
Operational underwriting for manufacturing, in hours.
DeXM OS turns ERP, Excel and CSV data into a full operational diligence report: SKU economics, EBITDA leakage, cash release and a 100-day plan, in hours, not weeks.
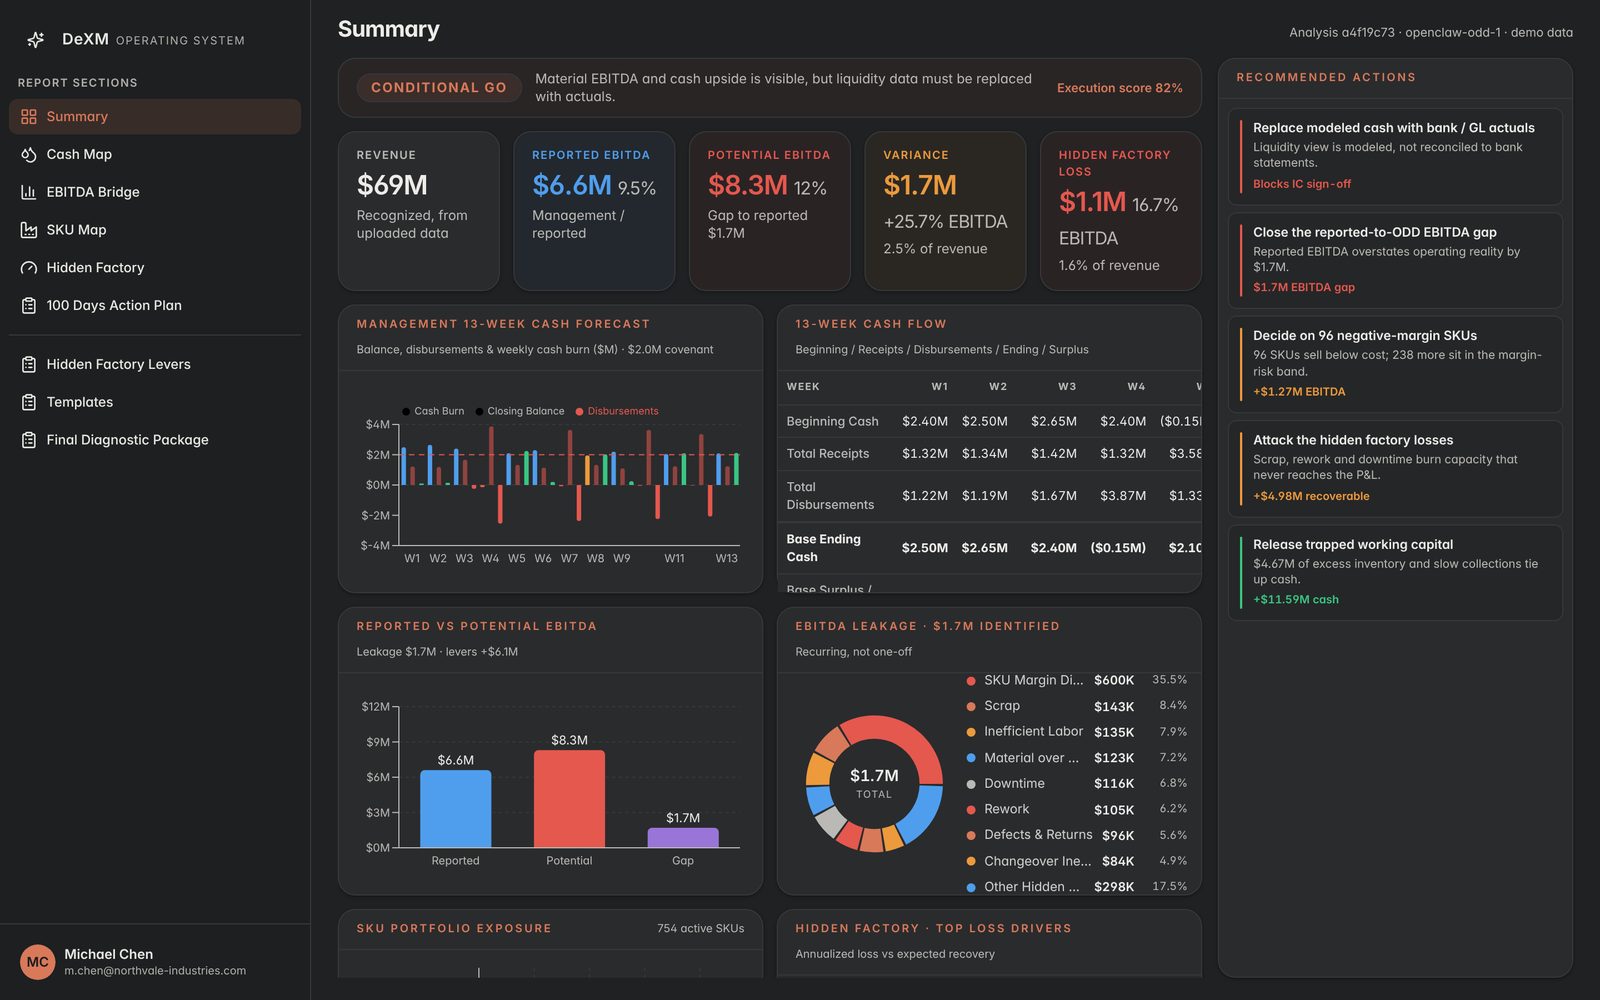
From raw ERP export to a defensible IC memo.
Three steps. Same rigor as a full operational diligence, in a fraction of the time.
Upload ERP, Excel and CSV
SKU financials, sales orders, production orders and inventory snapshots. No integrations, no engineering time.
DeXM normalises SKU → cash
Twelve months of data reconciled through the same SKU-to-cash model used in operational diligence. No more Excel forensics.
Full diligence report, ready
Ten indicators, EBITDA bridge, cash-leakage map, hidden factory, 100-day plan and an investment recommendation you can defend.
Ten diligence indicators. One decision.
Every indicator is a full page in the report, with formulas, source files and an implication a partner can read out loud.
Screening summary
Recommendation with rationale, headline KPIs and diligence gates.
Cash leakage map
Where dollars evaporate: SKU margin loss, freight, expediting, penalties.
EBITDA bridge
Reported → normalised → run-rate, every adjustment traced to source.
SKU map
Core, growth, tail, loss, with prune and reprice recommendations.
Hidden factory
Scrap, rework and yield loss recast as recoverable EBITDA.
Risk score
Weighted composite across quality, delivery, working capital and mix.
Operational health
Ten indicators traffic-lighted against underwriting-grade thresholds.
Turnaround potential
Sized upside per lever: pricing, mix, scrap, OTIF, working capital.
Funding readiness
Cash runway, burn, covenant headroom and the case for capital.
100-day actions
Owner-assigned, cash-impact-ranked, ready for the IC pack.
A real screen. Real numbers.
The same format your IC pack lands in. Screens below use an illustrative demo dataset, not client data.
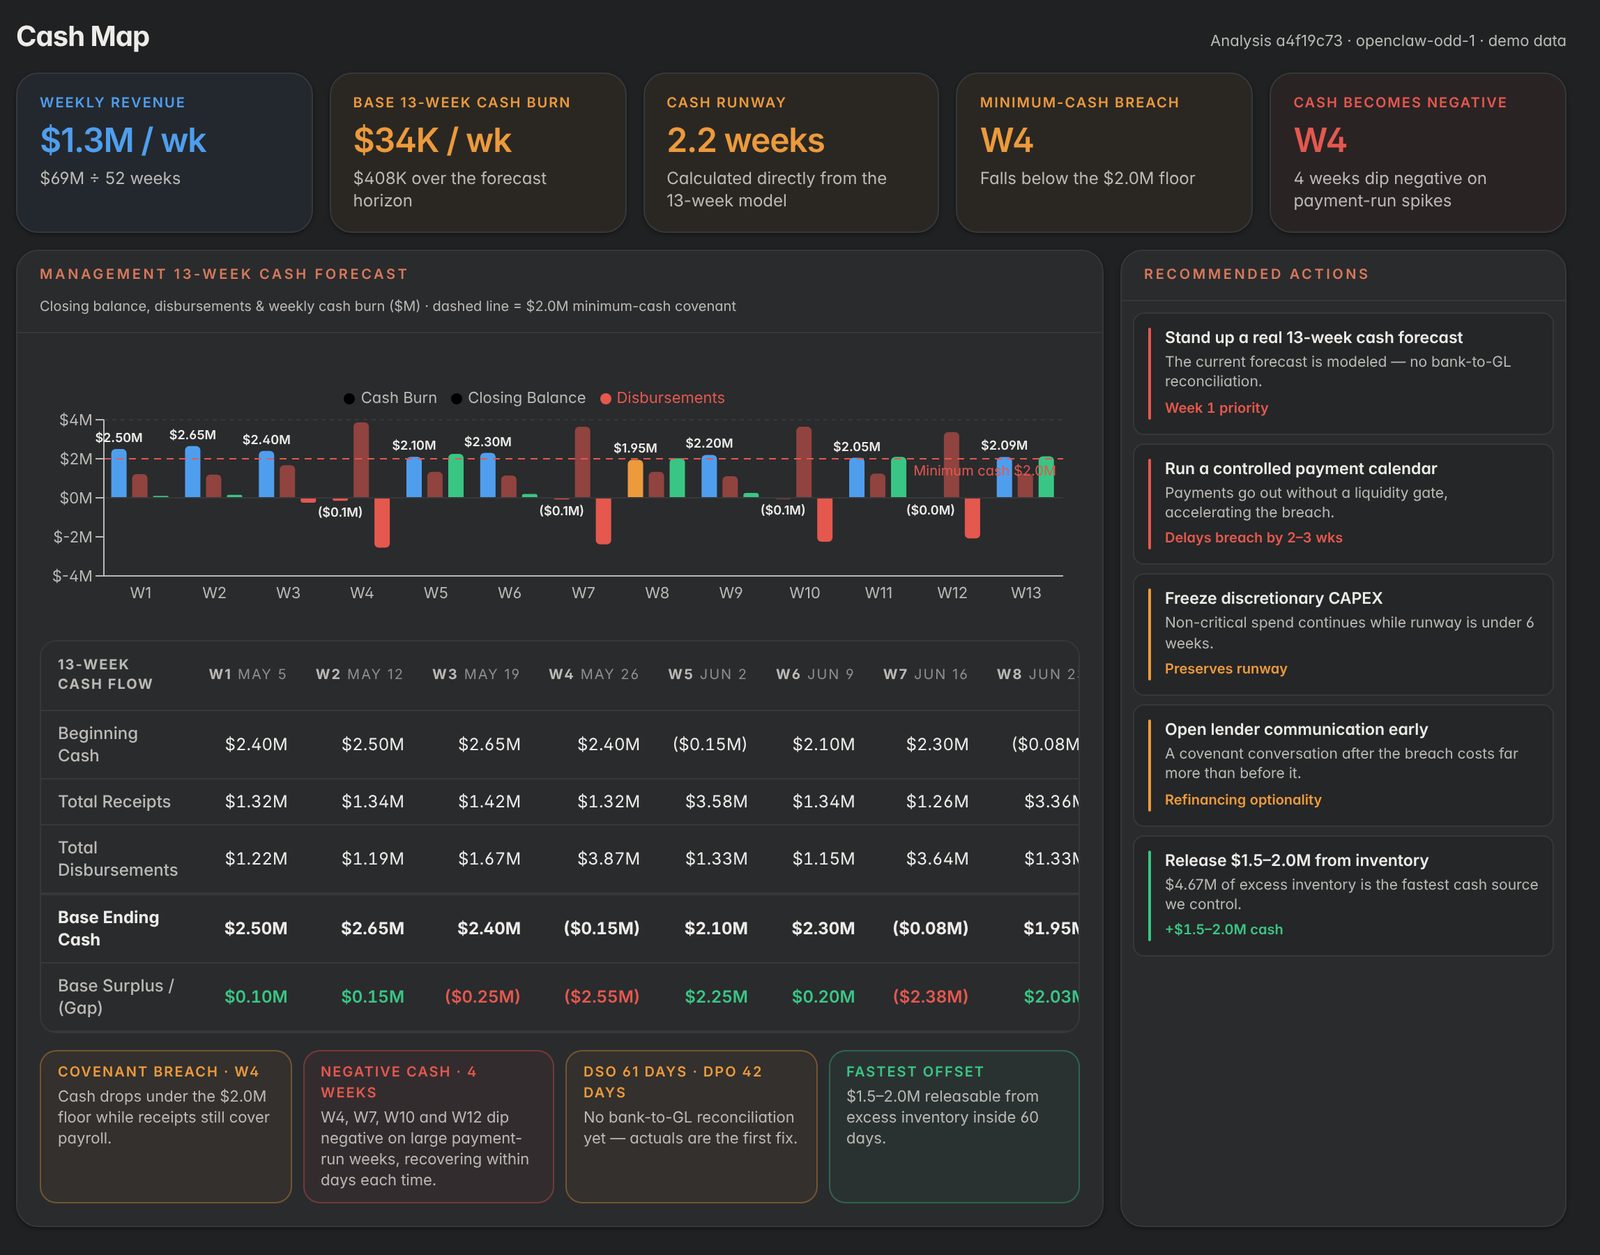
See the week cash breaks the covenant.
A 13-week cash model with weekly receipts, disbursements and burn against the minimum-cash covenant, plus the actions that buy back runway first.
- Minimum-cash breach and negative-cash weeks flagged
- DSO / DPO and fastest cash offsets
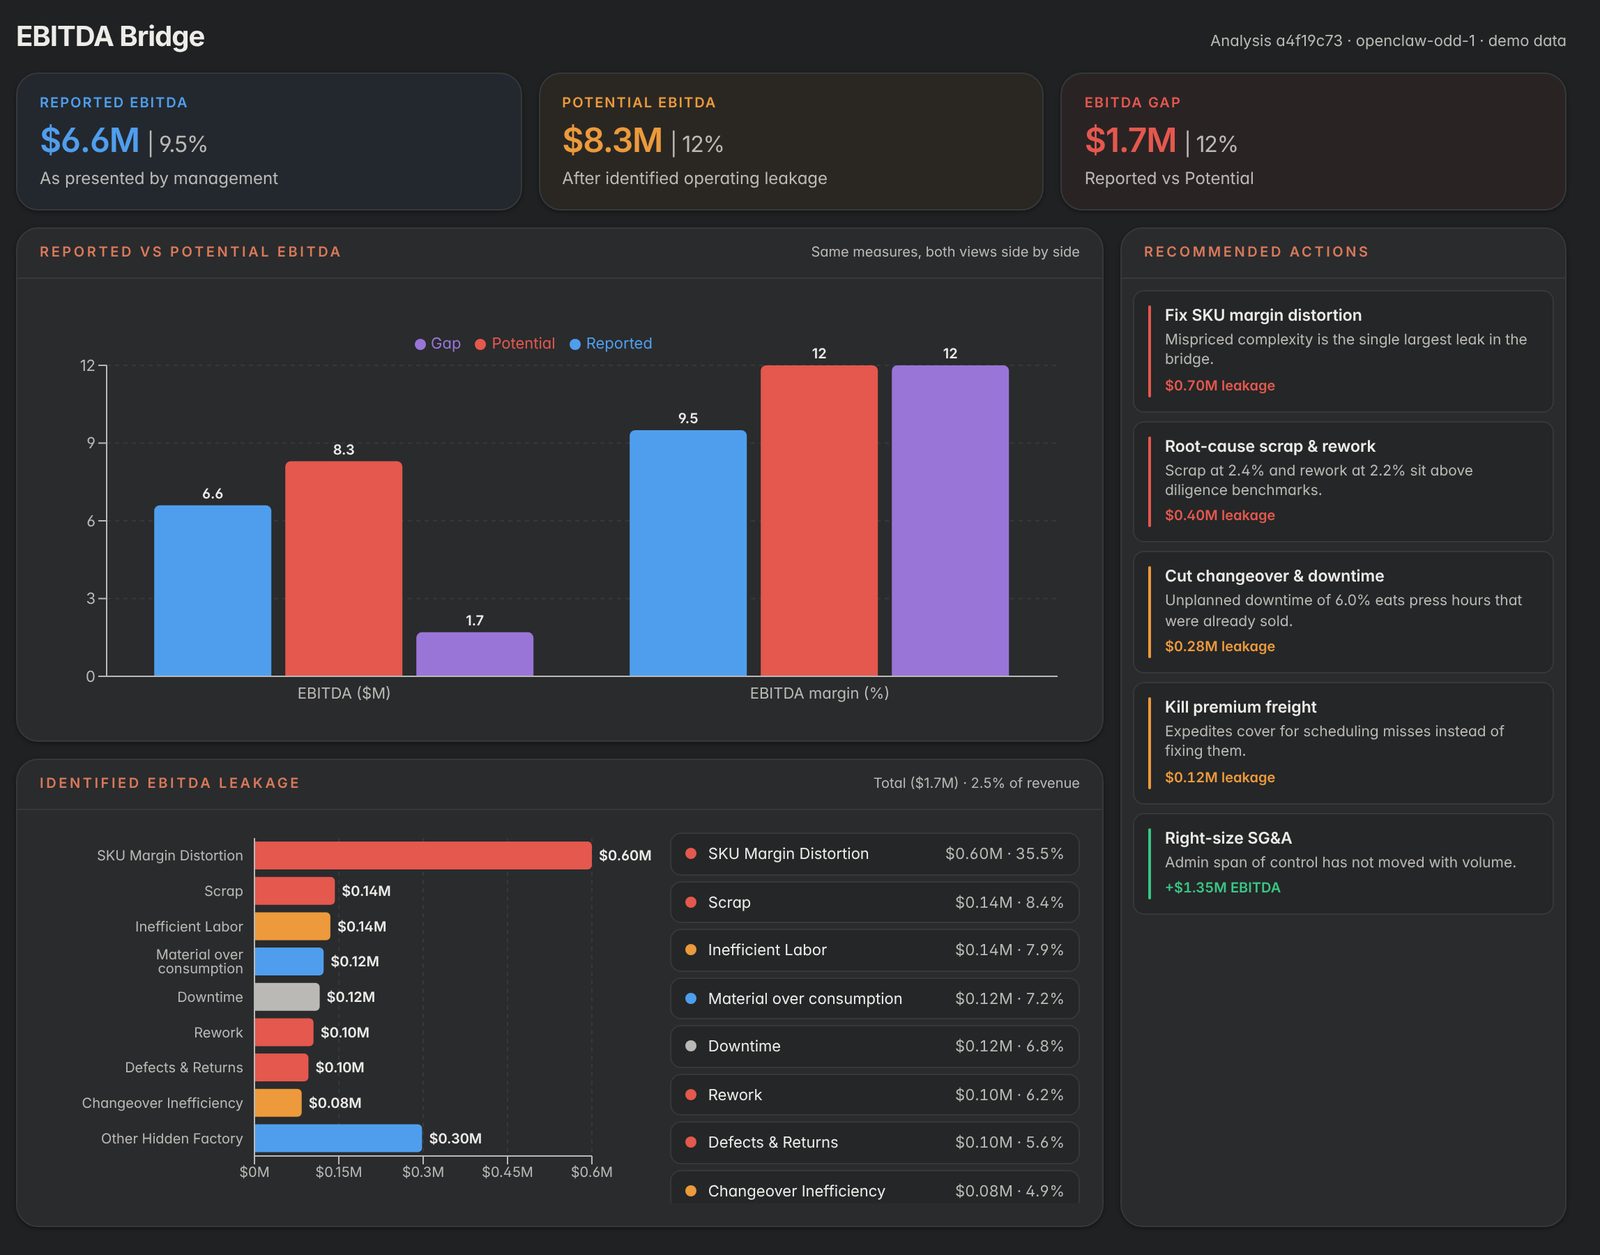
Reported versus potential EBITDA, side by side.
Every dollar between what management reports and what the operation can earn, broken into SKU margin distortion, scrap, labor, material, downtime and rework.
- Leakage by category, recurring not one-off
- Recommended actions sized in EBITDA
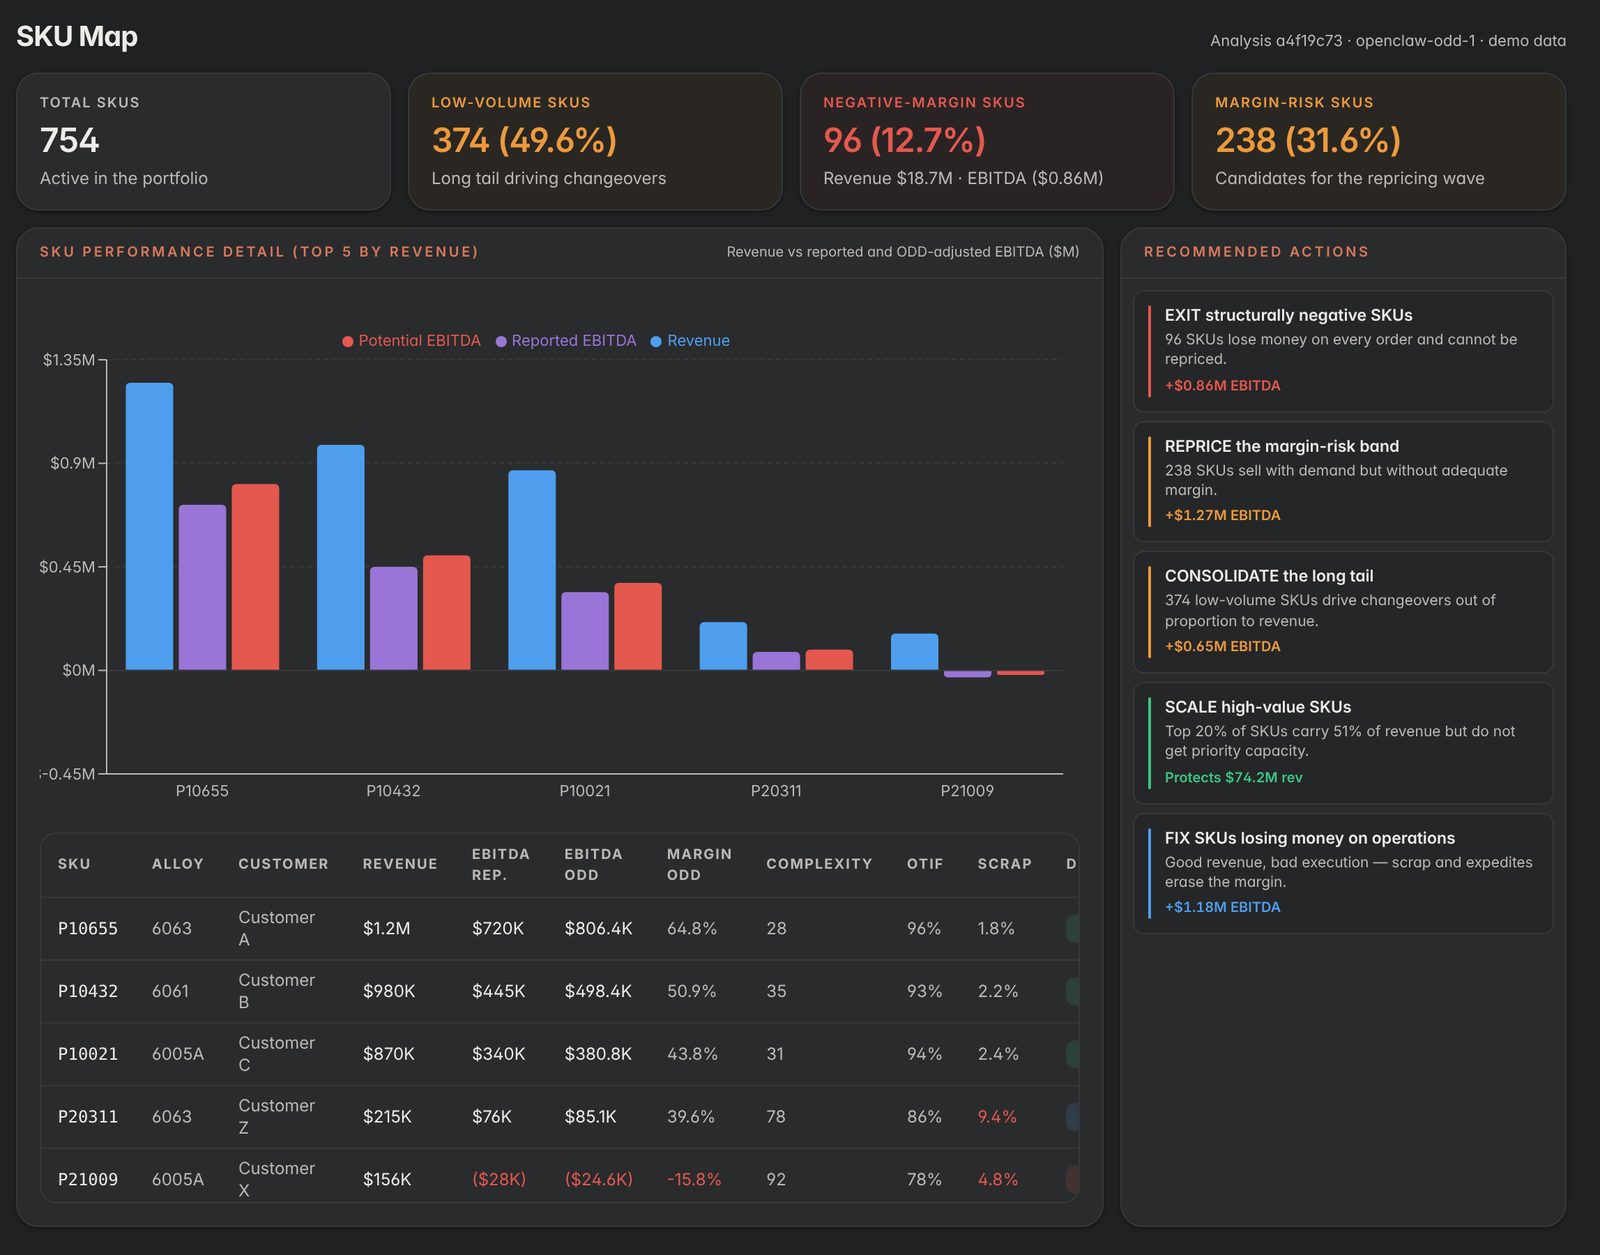
Know which SKUs make money and which burn it.
Revenue, reported and diligence-adjusted EBITDA, complexity, OTIF and scrap for every SKU, with a decision for each: scale, reprice, consolidate or exit.
- Low-volume tail and changeover drag
- Repricing wave candidates
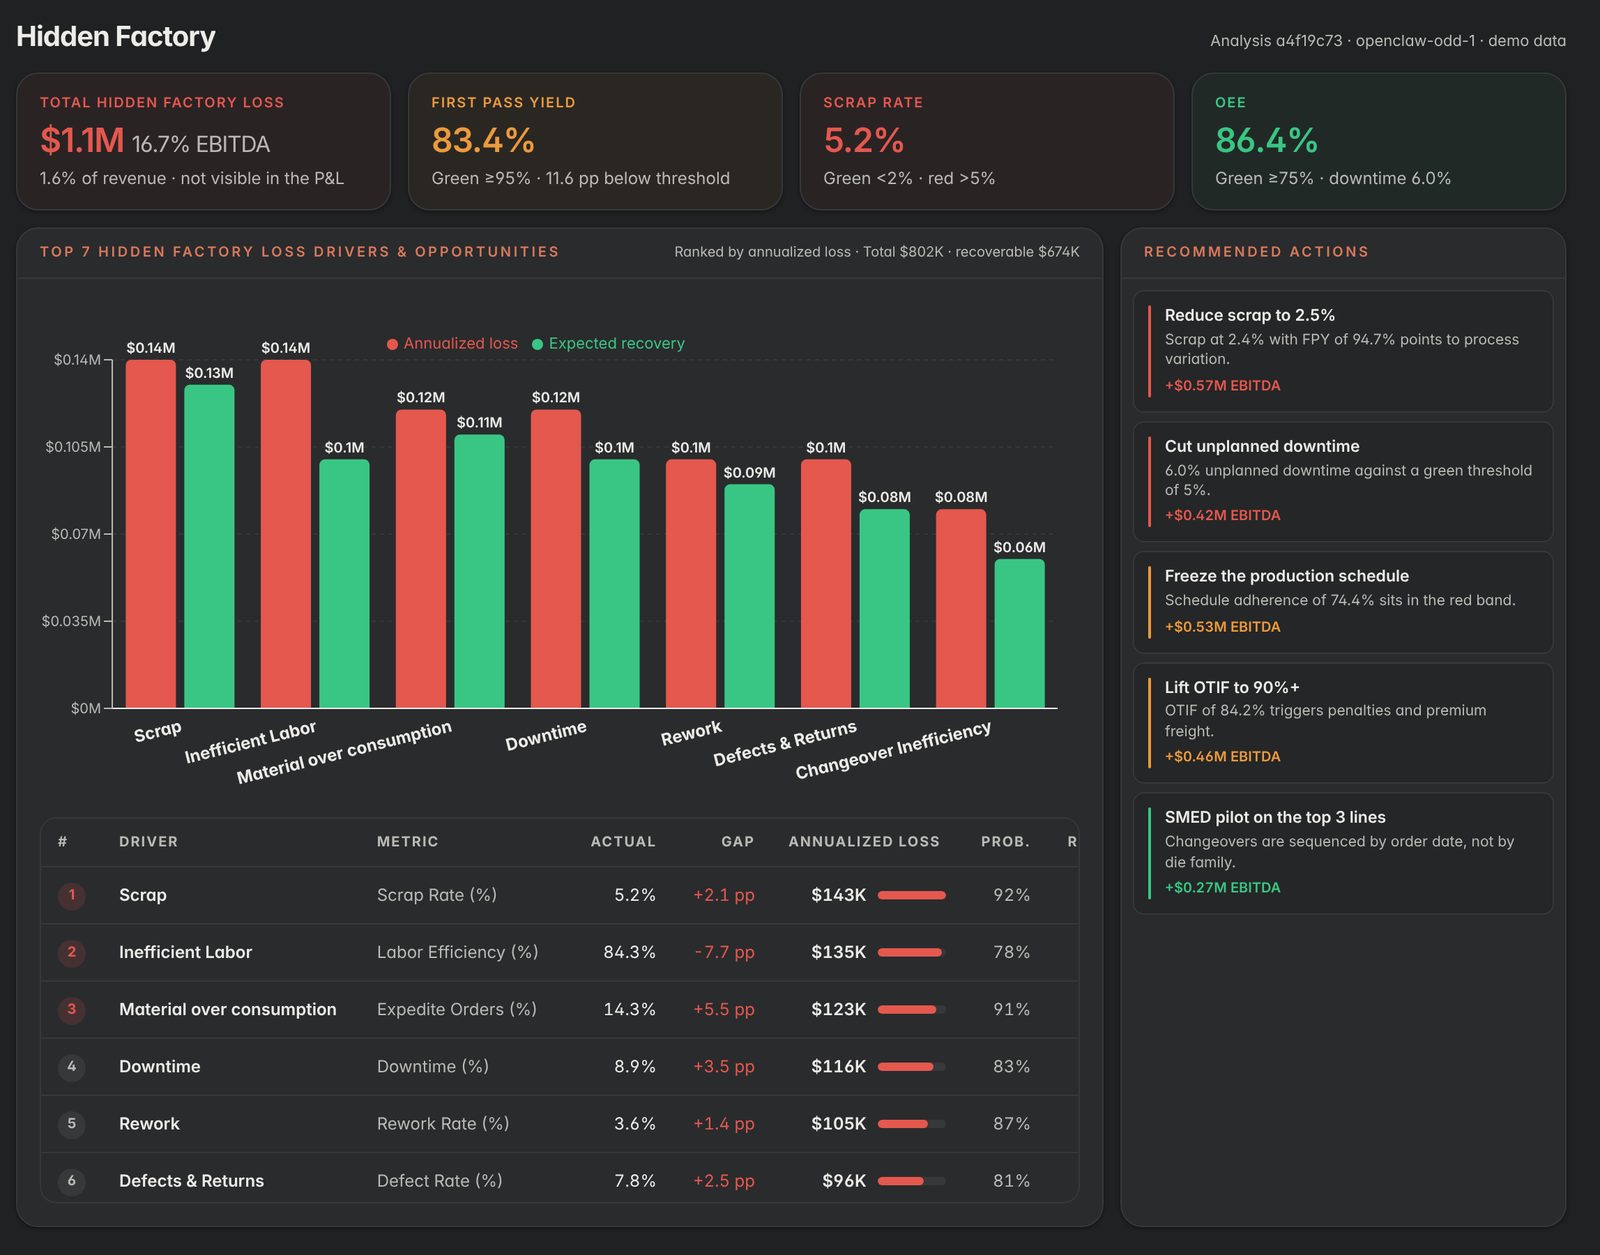
Recast scrap, rework and downtime as recoverable EBITDA.
First-pass yield, scrap rate and OEE against thresholds, with the top loss drivers ranked by annualized loss and expected recovery.
- 67 standard levers across 10 loss buckets
- Validated on the floor, sized into the final package
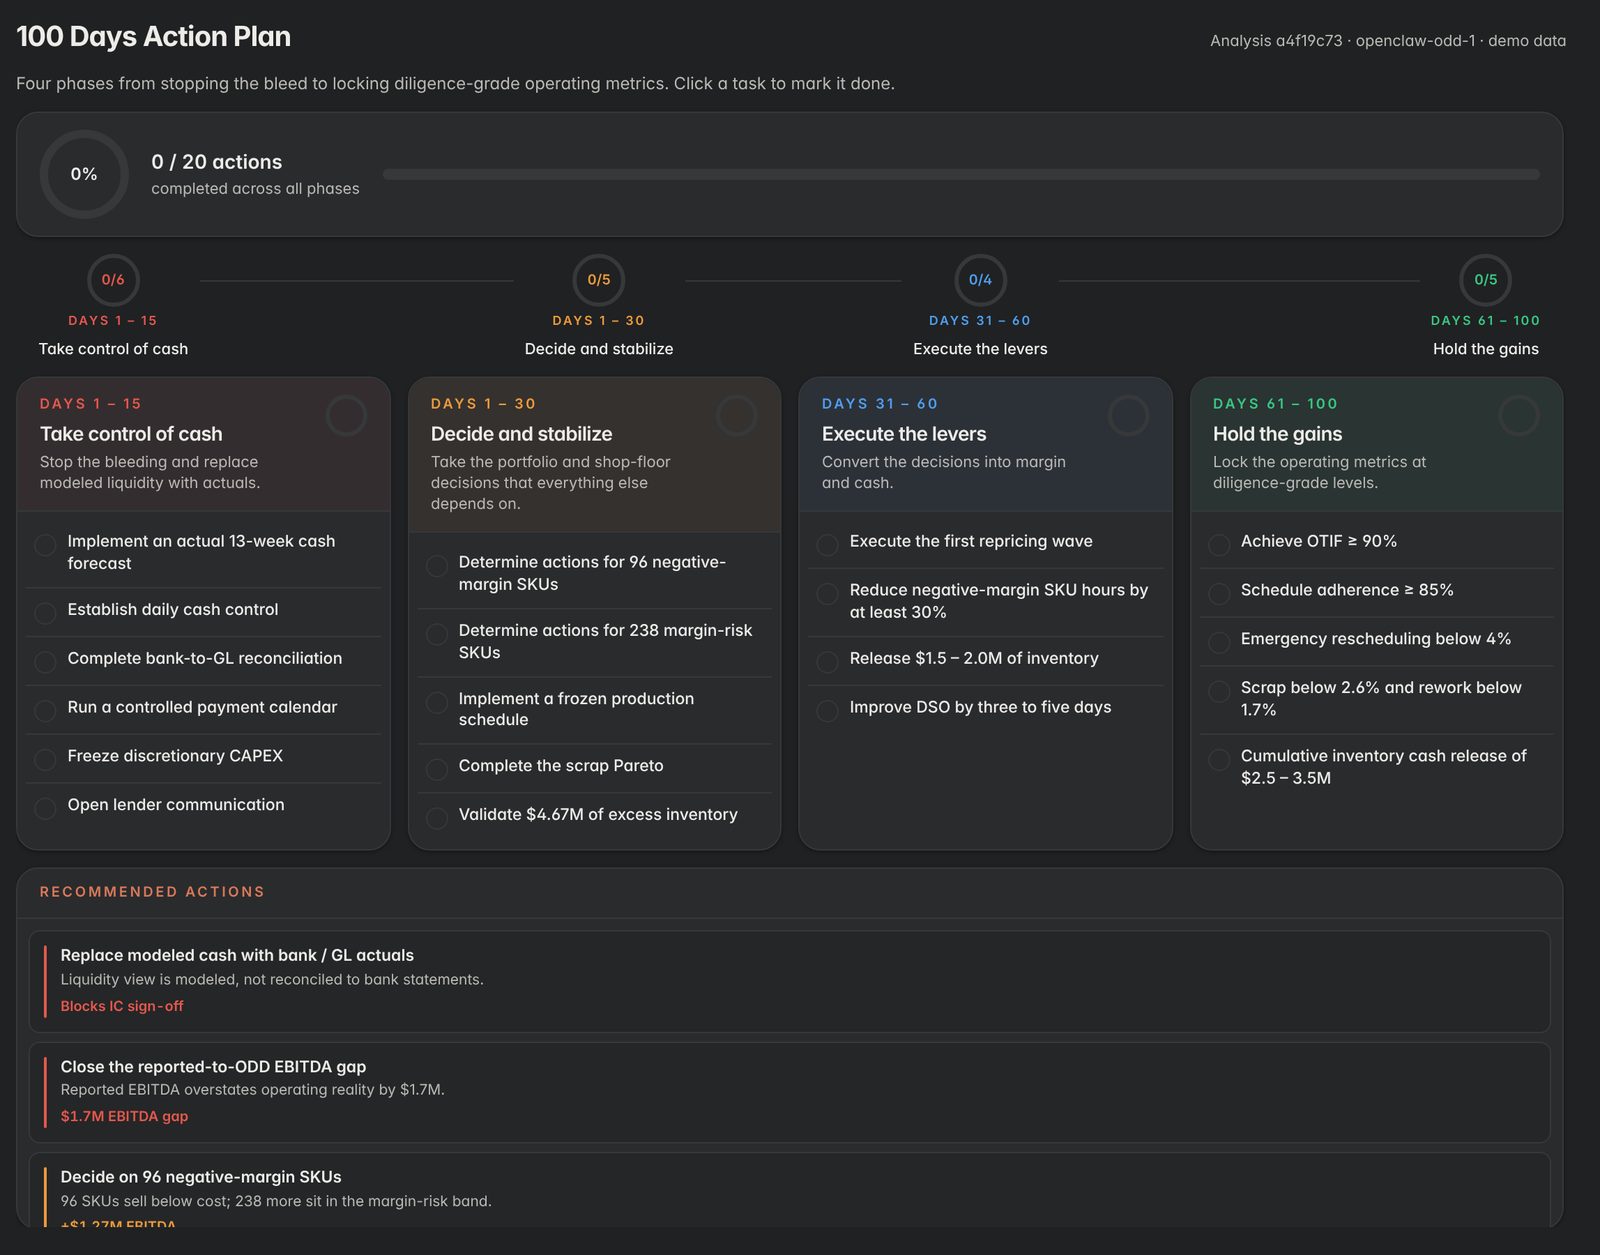
From stopping the bleed to locking the gains.
Take control of cash, decide and stabilize, execute the levers, hold the gains. Owner-assigned actions ranked by cash impact, tracked to completion.
- Days 1–15: cash control and actual 13-week forecast
- Days 61–100: diligence-grade operating metrics
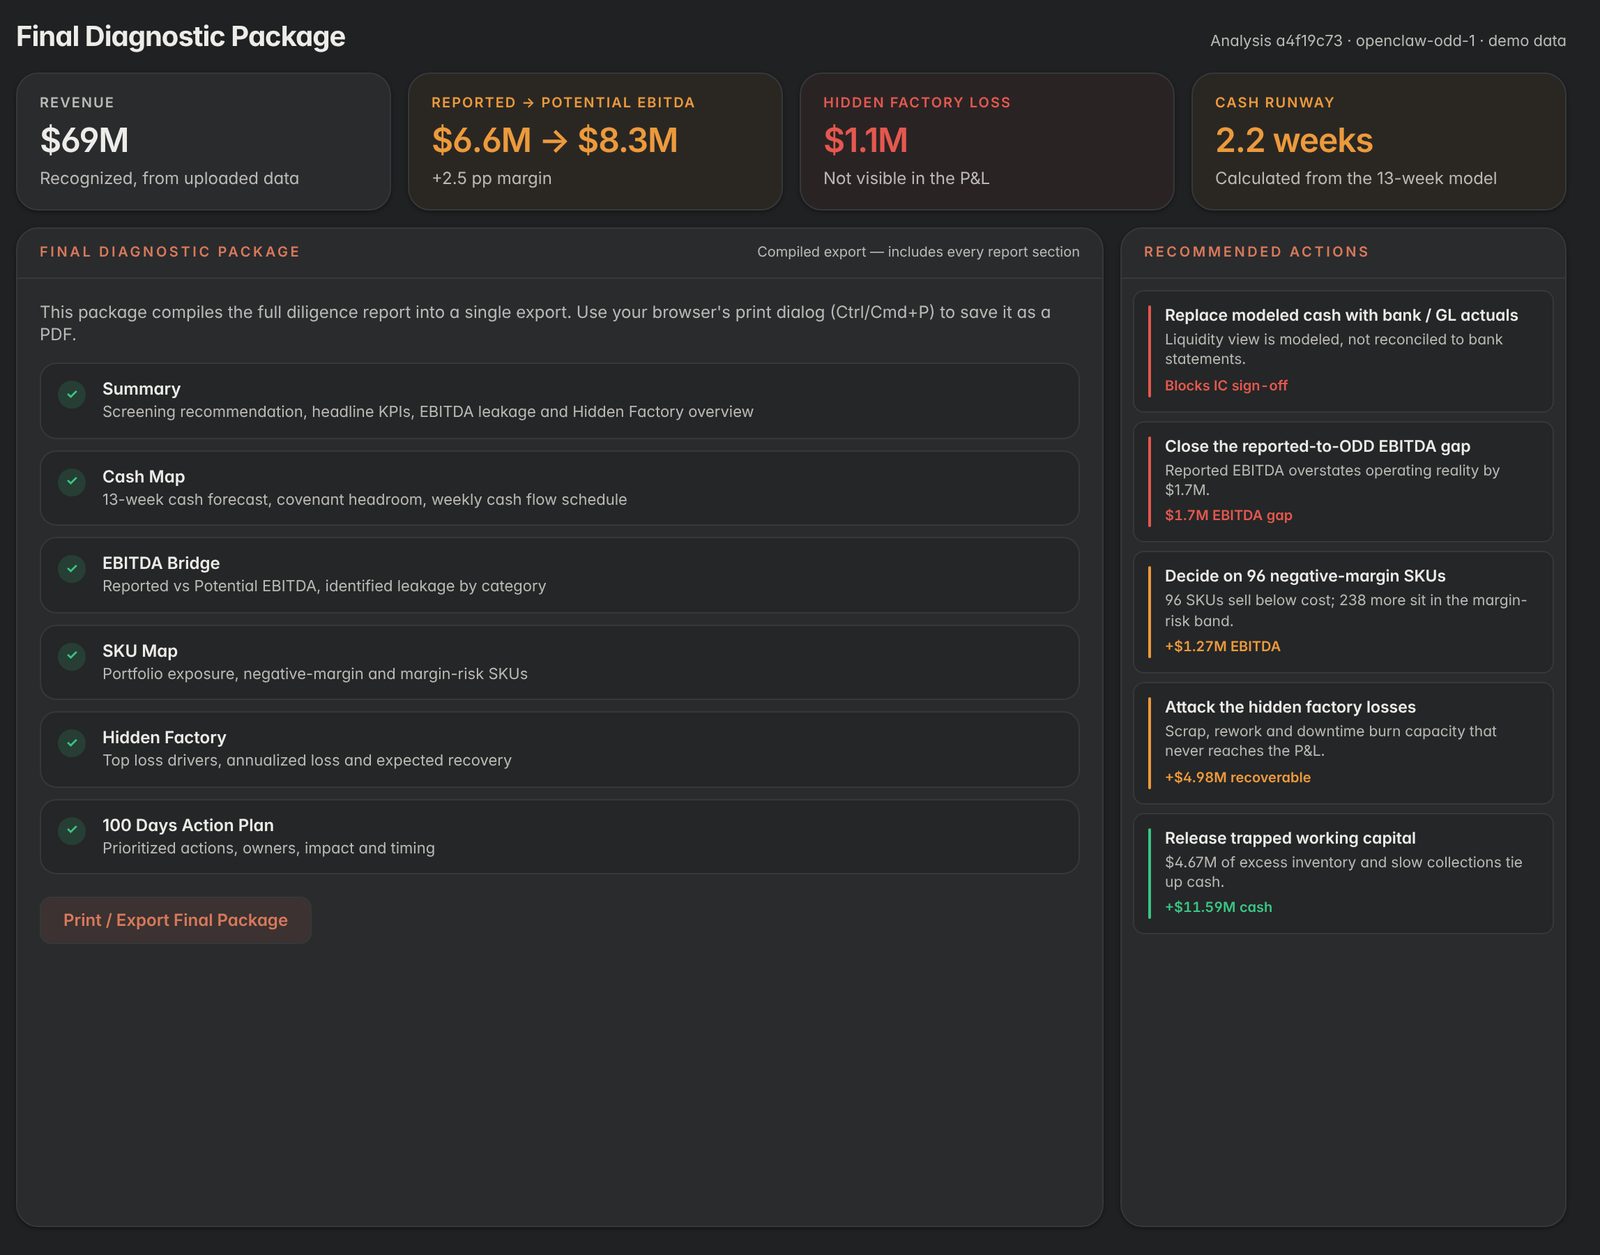
One export for the Investment Committee.
Summary, cash map, EBITDA bridge, SKU map, hidden factory and the 100-day plan compiled into a single IC-ready package, with reference templates for your own data pulls.
- Print-ready PDF and editable deck
- 13-week cash, SKU margin, EBITDA bridge and action-plan templates
Book an Intro Call
Bring an ERP export from your next deal or portfolio company. We will walk you through the report on your own numbers.